Spatial Clustering of Unvaccinated Kindergarteners in California

2001-2015


For the past 100+ years, vaccines have been revolutionizing healthcare. They provide a relatively low-cost, easy to attain preventative alternative to treatments for otherwise highly contagious and common diseases like chickenpox, measles, mumps, the flu, and diptheria. Just in the United States, vaccines are projected to save hundreds of thousands of lives and prevent millions of hospitalizations among children who were born between 1994-2014.


There are 5 vaccinations which are typically mandatory for children entering kindergarten:

Despite all of the strides forward that have been made in public health since the advent of vaccinations, the mission to get all children vaccinated is an uphill battle. Misinformation runs rampant when it comes to vaccines, so many vaccine-preventable diseases continue to appear in outbreaks where they otherwise could have been eradicated. Measles was initially declared eliminated in the United States in 2000. That can not necessarily be said any more, as with the rise of vaccine hesitancy comes annual outbreaks of vaccine preventable diseases like measles and pertussis.


To understand why vaccines are so important, you need to understand herd immunity.


Herd immunity is the idea that when most of the population is vaccinated, those who are to young, too sick, or otherwise medically unable to receive vaccines will be protected from the spread of contagious diseases. Most epidemiologists agree that this requires around 95% of the population to be vaccinated. This creates a sort of human immunity buffer around those whose health is most vulnerable. And given that only about 3% of the population has valid reason to claim a medical exemption from receiving vaccinations, this should be no problem.


However, prior to 2016, California allowed parents to claim personal belief exemptions -- and between 2013 and 2015, specific religious belief exemptions -- to prevent their children from receiving the vaccines mandated by the state for children to be enrolled in school.


Compare the data on the interactive map below with the chart depicting the number of kindergarten students in California and the percentage of them that were considered up-to-date on their vaccinations between 2001 and 2015. Between 2010 and 2015, it is clear that some years saw a drastic decrease in the percentage of children receiving vaccinations, despite the uptick in number of kindergarten students.


Click on a circle to identify the specific county and incident count. Click and drag the slider bar or the accompanying buttons to progress through time.


The maps below visualize California schools, public and private, between the years 2001 and 2015. Each dot represents one school that reported vaccination data to the state and its geocoded location.* There is one map per year for each of the two diseases we examined: pertussis and measles. The same data was used to create both maps: the percentage of kindergarten students who were considered up-to-date on their mandatory vaccinations in the given year. However, the data is classified differently: the theoretical herd immunity threshold for pertussis is set at 85% and the threshold for measles is set at 95%. The general conclusion we can draw from these maps is that, while the overall percentage of children who were up to date on their vaccinations may have increased over the years, and thus the number of schools who fell somewhere in the middle as far as immunity goes went down, there are now more schools that fall in one of the extremes: almost all their students or vaccinated, or dangerously few of them are.


Click on the blue circle situated in the center of each map and slide from side to side to compare school-level vaccination levels.


To view the entire map series that was designed for this project, click here.

This trend towards the extremes is especially evident in the maps representing theoretical pertussis immunity. The map appears darker overall; since the color classifications are designed to create visual hot spots representative of high rates of unvaccinated children, this may lead one to assume that a higher percentage of the population is vaccinated, when this is really not the case. Rather, there are now more distinct spatial clusters of unvaccinated children. This many unvaccinated or under-vaccinated individuals in close proximity is a serious threat to public health when even one child comes down with pertussis or measles.


Since California tightened vaccination regulations in 2016 by eliminating personal and religious belief exemptions, which leaves only medical exemptions as a valid reason for a child to not receive vaccinations, one would expect that vaccination rates would rise. And this is true -- but not without some unexpected side consequences. Medical exemptions have quadrupled since the new law took effect. And again, given that no more than 3% of the population realistically needs these medical exemptions, it is clear that the new laws have lead some parents to take drastic measures to prevent their children from being vaccinated.


Despite this discouraging side effect of the new vaccine laws, vaccination rates have, overall, gone up, with over 95% of the kindergarten population being reported as fully up-to-date on vaccinations for the 2017-2018 school year. While this looks like herd immunity has been achieved on a broad scale, these spatial analyses show that spatial clusters of unvaccinated children can cause serious public health threats. These clusters are something to be wary of as epidemiologists and public health scientists in California, and across the United States, look for ways to combat the vaccine hesitancy crisis.


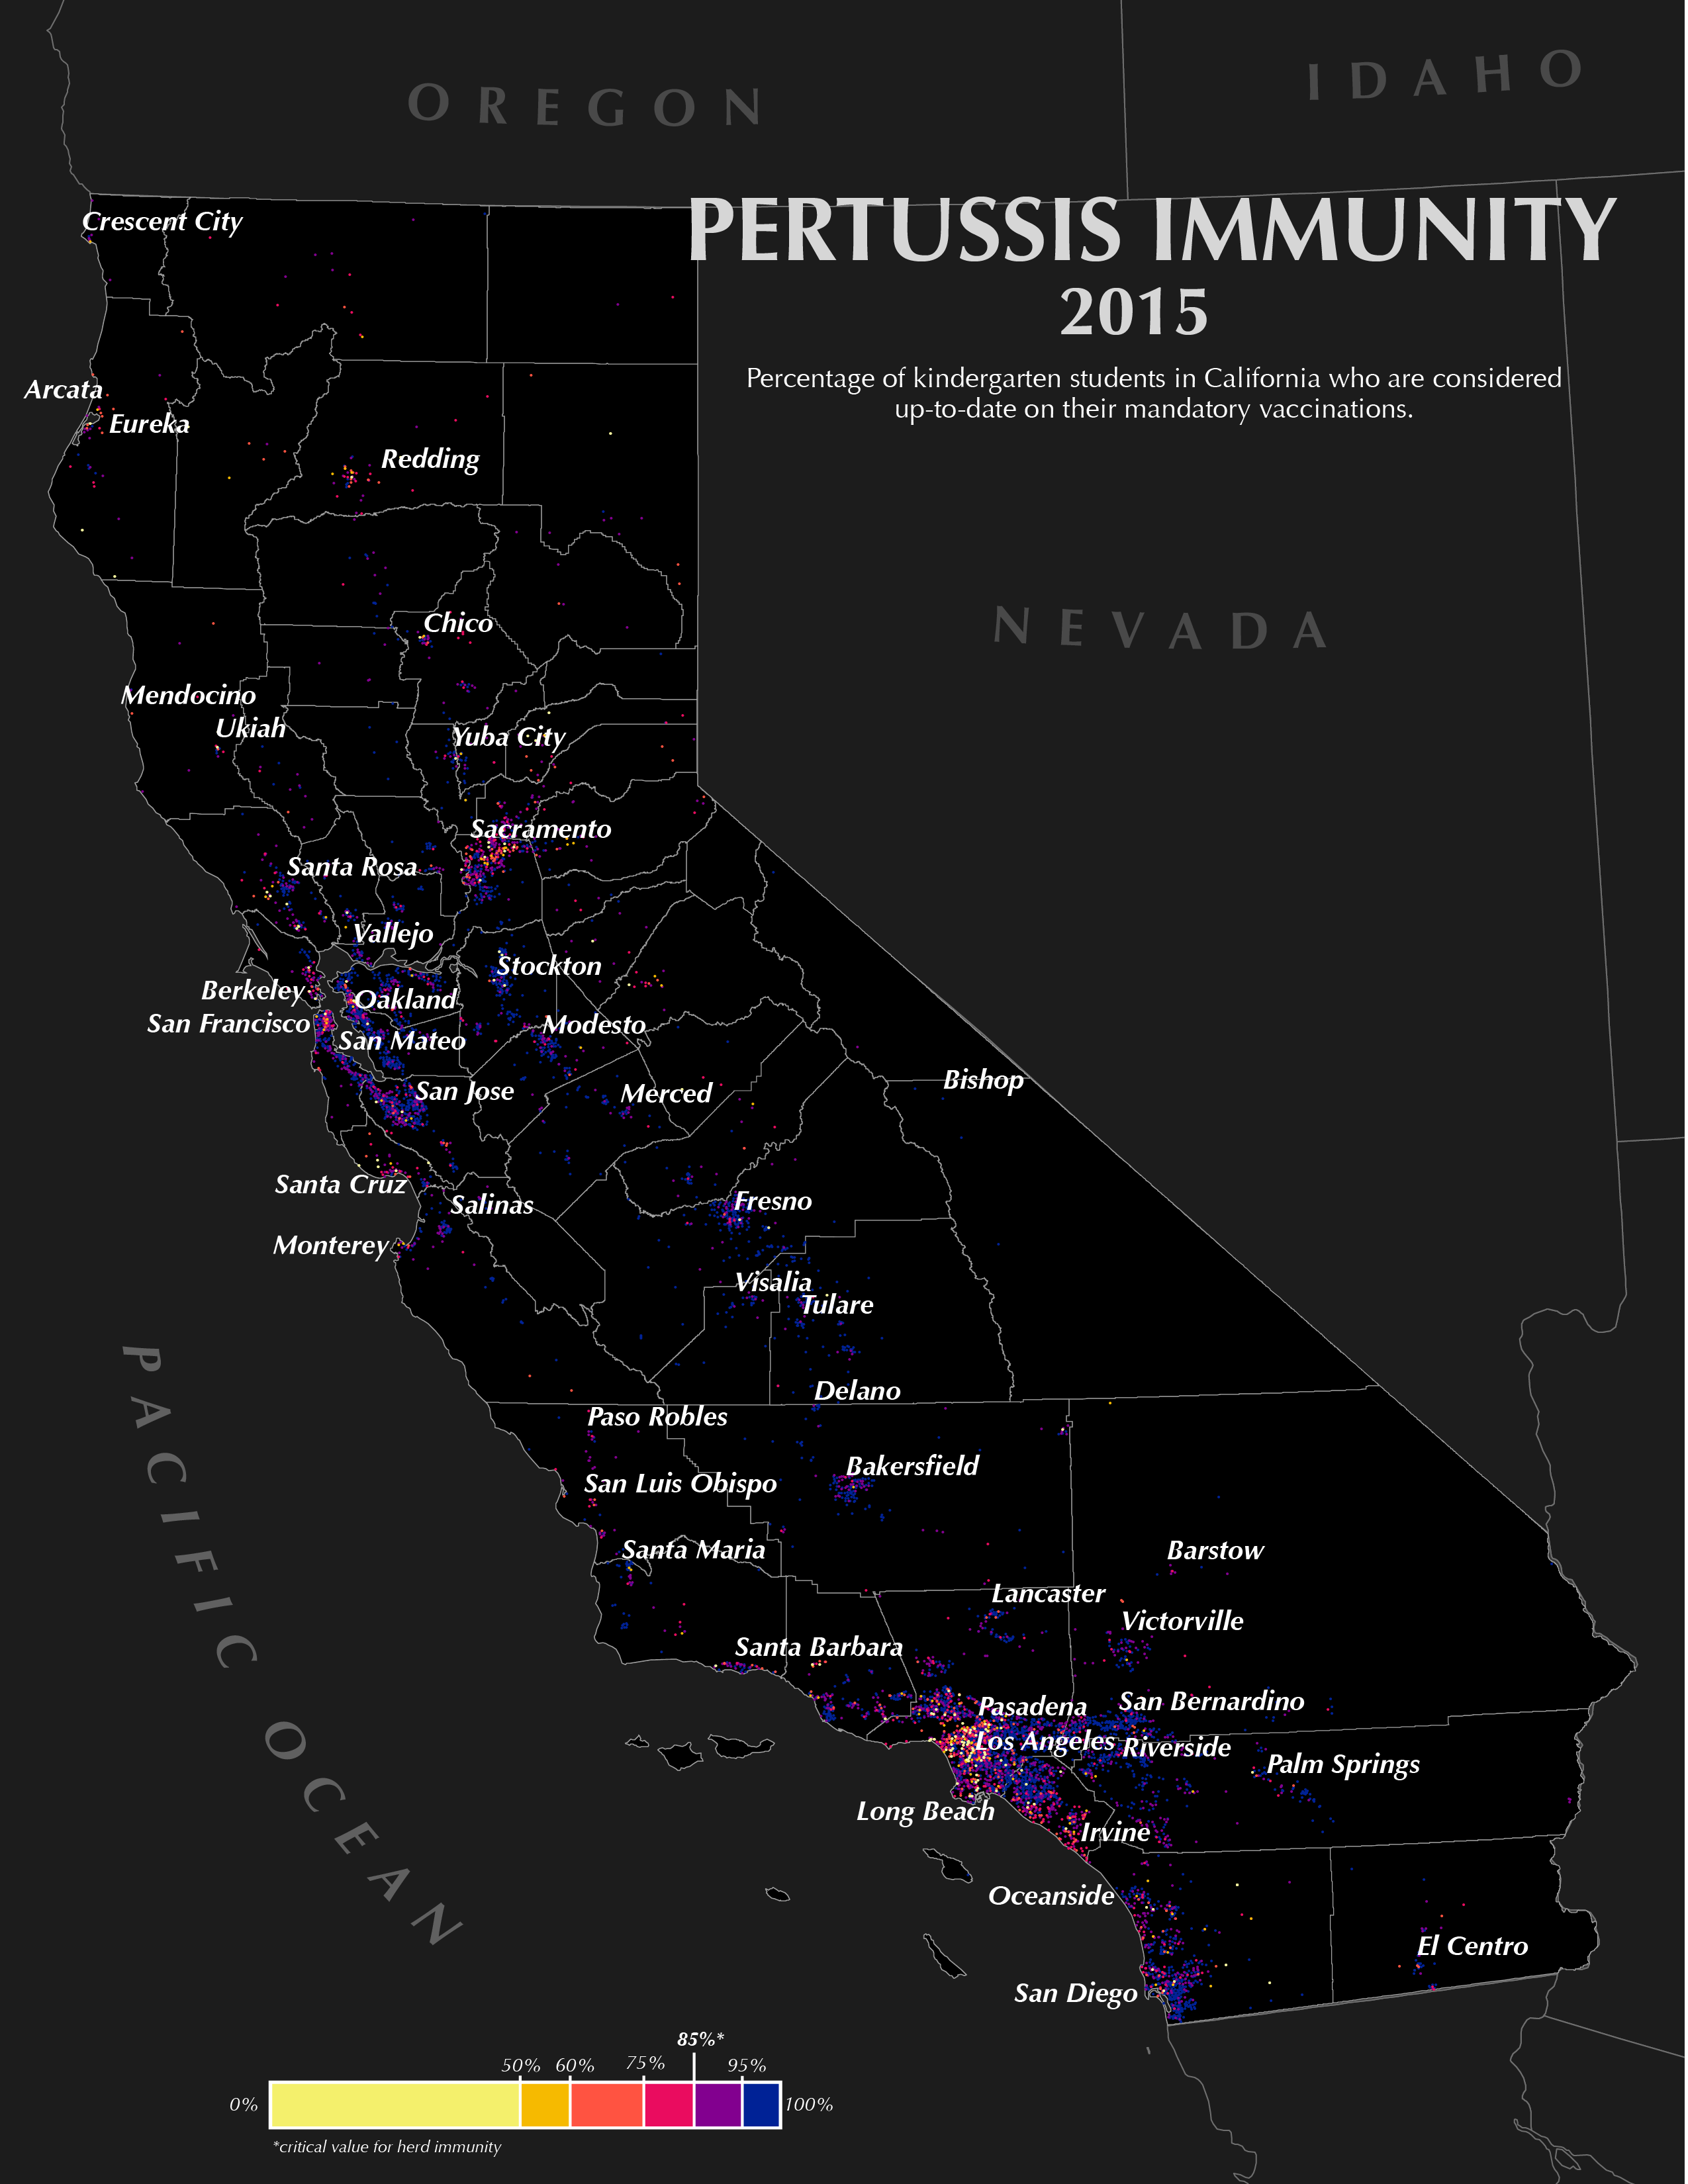
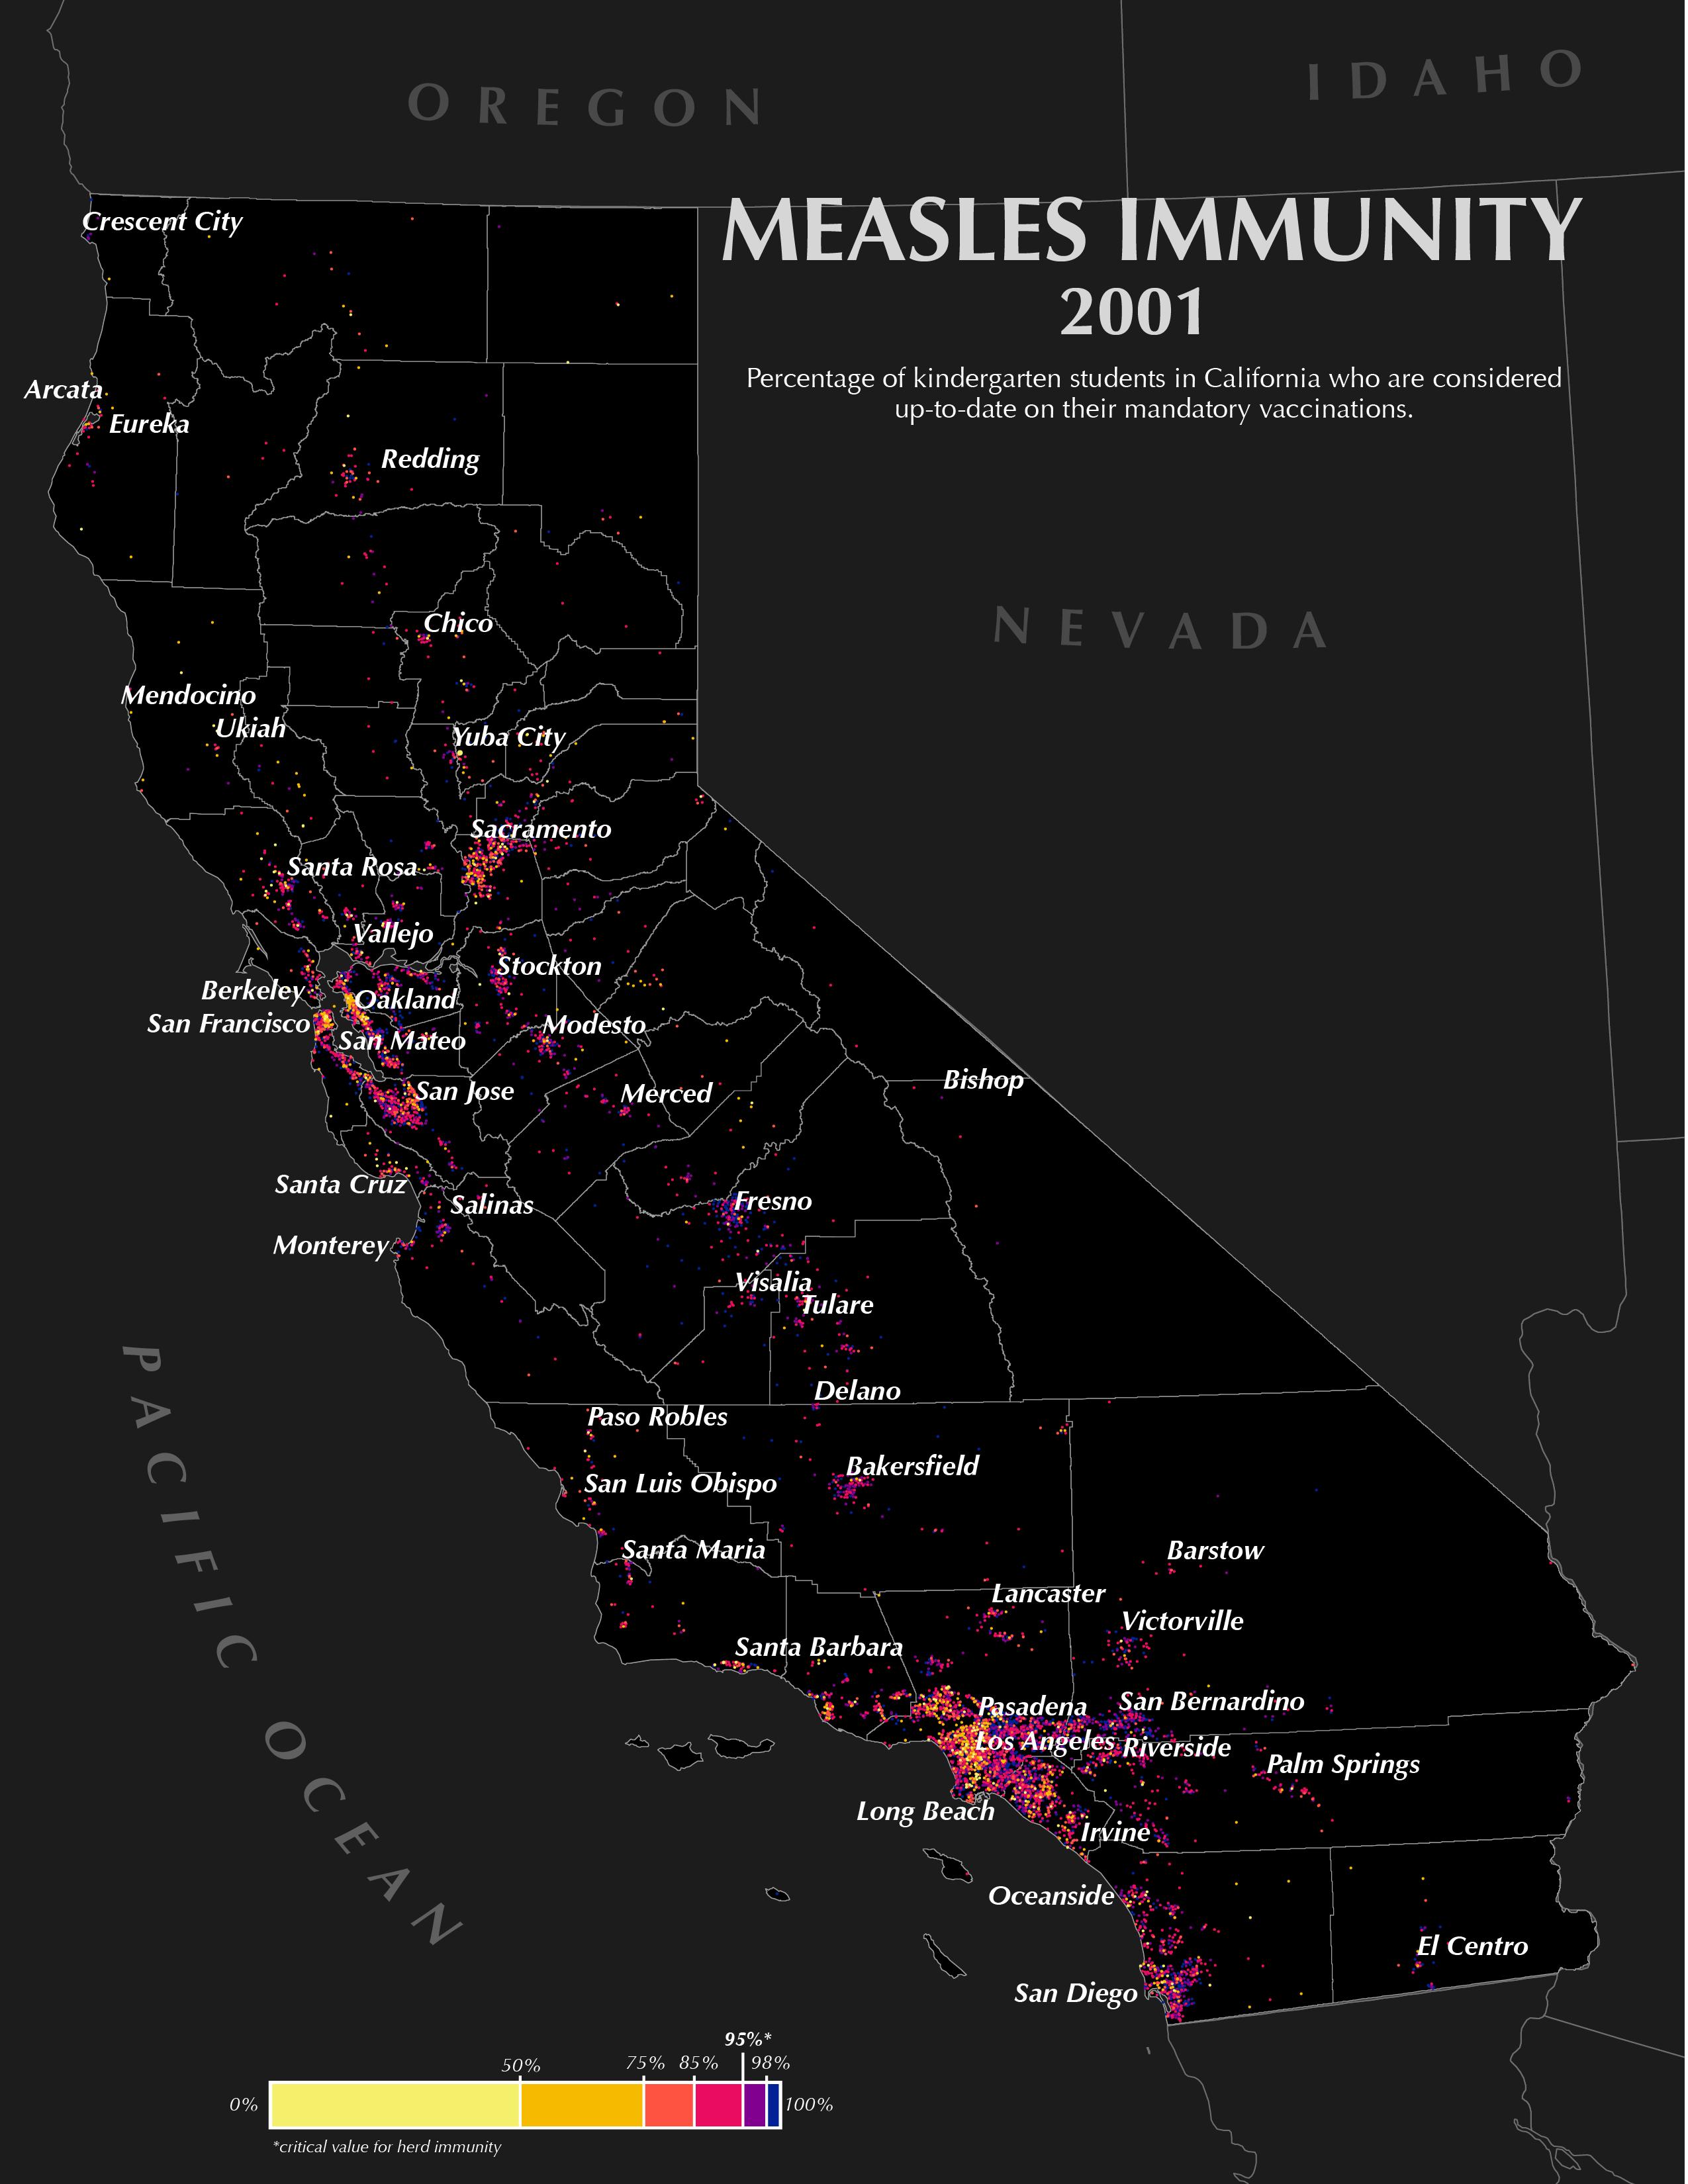
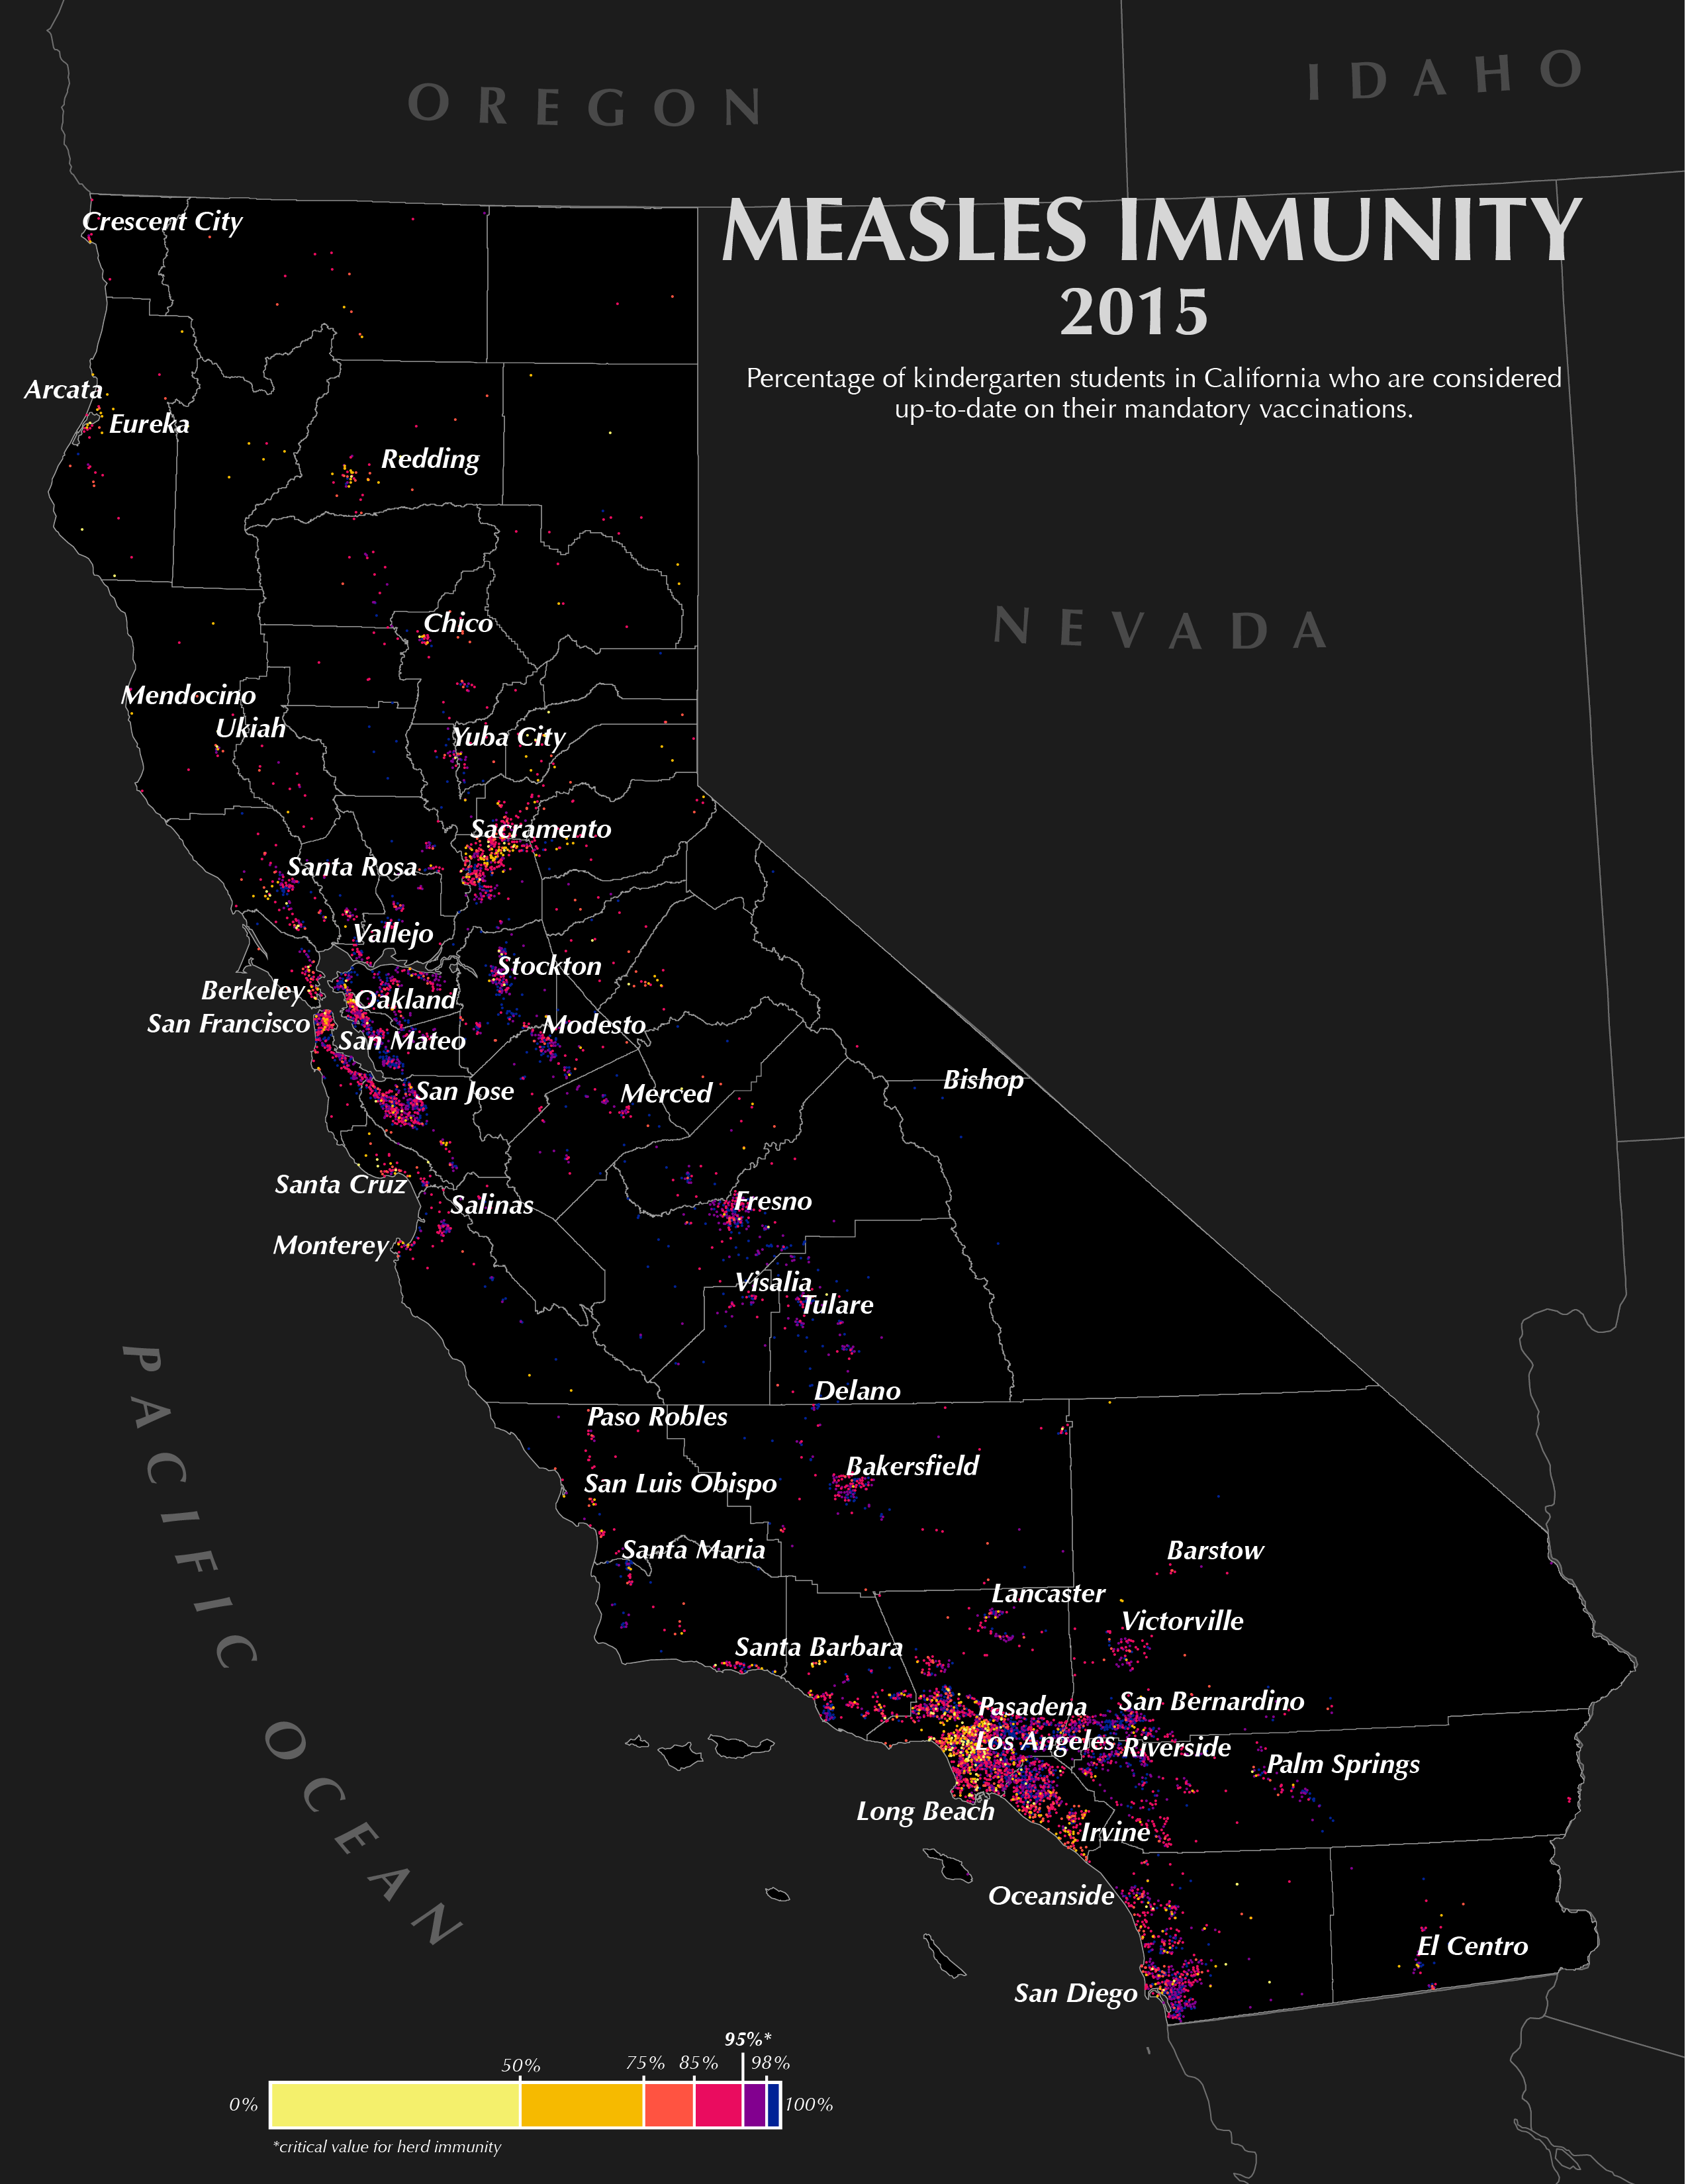
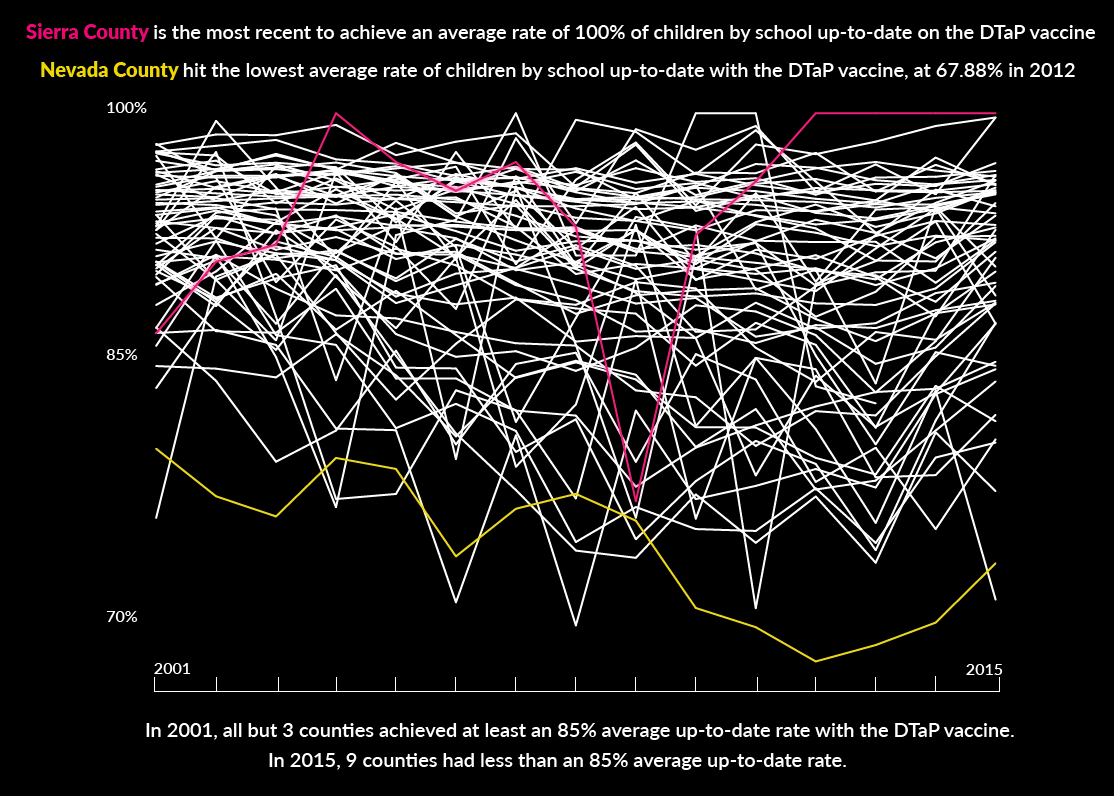
All maps and graphics created by Ellie Milligan

For completion of the Master of Science degree in Cartography and Geographic Information Systems at the University of Wisconsin - Madison in April 2019, in conjunction with Dr. Malia Jones and the University of Wisconsin Applied Population Lab.

Data Sources: California Department of Public Health, Centers for Disease Control and Prevention, Vaccines.gov, ShotsForSchool.org

Maps: Data from the California Department of Public Health, California Department of Education, Natural Earth Data, and Data.gov // Projection: NAD 1983 HARN California Teale Albers